Overall Financial Performance
The results show a solid performance by the organisation as follows:
•
The Tertiary Education Commission, having observed Te Wānanga o Aotearoa consistently achieving financial criteria set down
for tertiary institutions, has assessed the organisation as ‘low risk’.
•
Budget targets were achieved.
•
Working capital continues to strengthen when compared with previous years.
•
Net assets (equity) have increased by $5 million during the year.
•
Te Wānanga o Aotearoa continues to have healthy cash reserves.
Equivalent Full Time Students (EFTS)
Our total consumed EFTS result for 2012 was 20,494 – an increase of 0.4% (74 EFTS) on 2011 numbers. Our highest enrolling
programmes were similar to prior years – Te Ara Reo Māori, Mauri Ora, computing, business, social services, health and sports,
learning skills and English language.
Te Wānanga o Aotearoa achieved 99.12% of its target EFTS funding and 100.06% of EFTS numbers. As this funding value falls
within the Tertiary Education Commission threshold (+/-3%), the organisation received 100% of its allocated funding for the year.
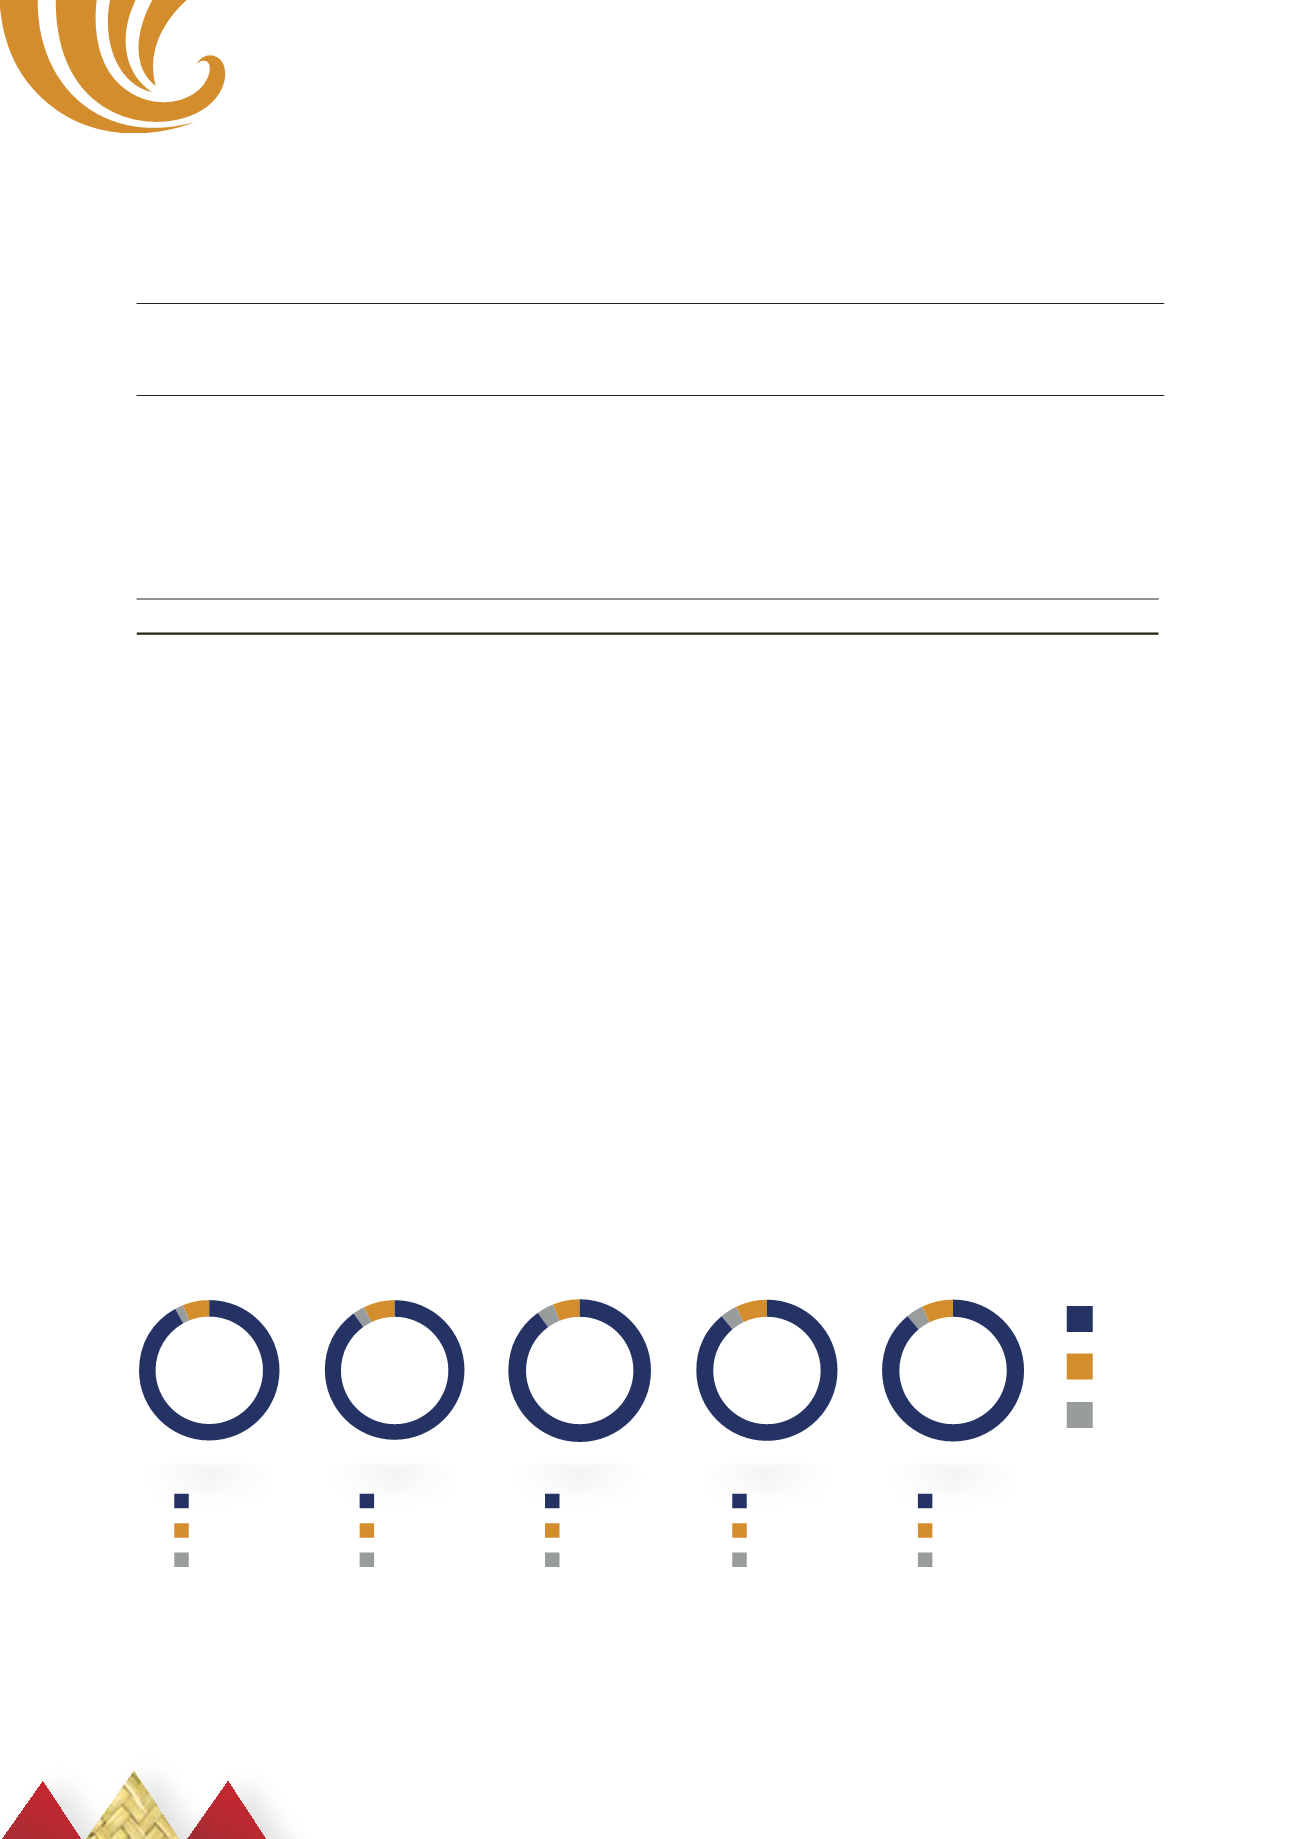
Income
The table below shows the profile of our income streams for the past five years.
The income profile for 2012 remained consistent with the profile from previous years. Government funding remains the primary
source of revenue for the organisation. Growth in tauira fee income was anticipated for 2012; however, due to lower than expected
international tauira enrolments and a change in the programme mix, this was not achieved.
Financial summary 2012
2008
2009
2010
2011
2012
Tauira fees
Other
(e.g. interest,
joint ventures)
Government
funding
huruhuru...
mā te
92%
2%
6%
90%
3%
7%
90%
4%
6%
89%
4%
7%
89%
4%
7%
The table below shows a comparison of 2012 performance for the Group against budget. 2011 figures are included for
comparative purposes.
Performance
Actual 2012 Budget 2012
TEC Guidelines
against
Actual 2011
$’000
$’000
guidelines
$’000
Surplus
7,947
6,023
N/A
7,286
Surplus
5.2%
3.9%
3-5%
↑
4.8%
Comprehensive Income
4,986
6,023
N/A
7,286
Cash
58,380
51,044
N/A
59,690
Cash Inflows/Cash Outflows
1.10
1.09
1.08
↑
1.13
Working Capital
34,126
29,678
N/A
33,844
Net Assets
138,764
139,204
N/A
133,778
Note: Cash includes cash and other financial assets in both current and non-current assets.
Te pŪrongo 2012
66


