18 TE PŪRONGO 2013
Prior qualification attainment
Each year, a comparatively large proportion of our tauira come to us
without having attained a qualification, either at secondary school
or at tertiary level. These people have often experienced years of
underemployment and unemployment, and this had led them to recognise
the important role education plays in gaining access to better jobs and
higher wages. These tauira enrol with us to start an educational journey
where they are supported and encouraged to achieve by engaged kaiako
and appropriate pastoral care and support systems. The following chart
shows the five year trend for the proportion of tauira enrolling with us who
had not previously achieved a secondary or tertiary qualification.
Ethnicity
Te Wānanga o Aotearoa is the largest
single provider of tertiary education
to Māori in Aotearoa New Zealand.
In 2013, 15,843 tauira (50%) who
enrolled with us indicated they had
Māori ancestry.
In 2010, the way ethnicity statistics
were reported changed and statistics
produced prior to this date are not
compatible with those produced since.
For this reason, we present a four year
trend for tauira ethnicity as follows:
Pasifika
European
Asian
Other
MāORI
50%
10%
33%
14%
10%
51%
11%
32%
14%
10%
48%
10%
41%
15%
4%
50%
10%
37%
14%
3%
38%
2009
35%
2010
31%
2011
33%
2012
35%
2013
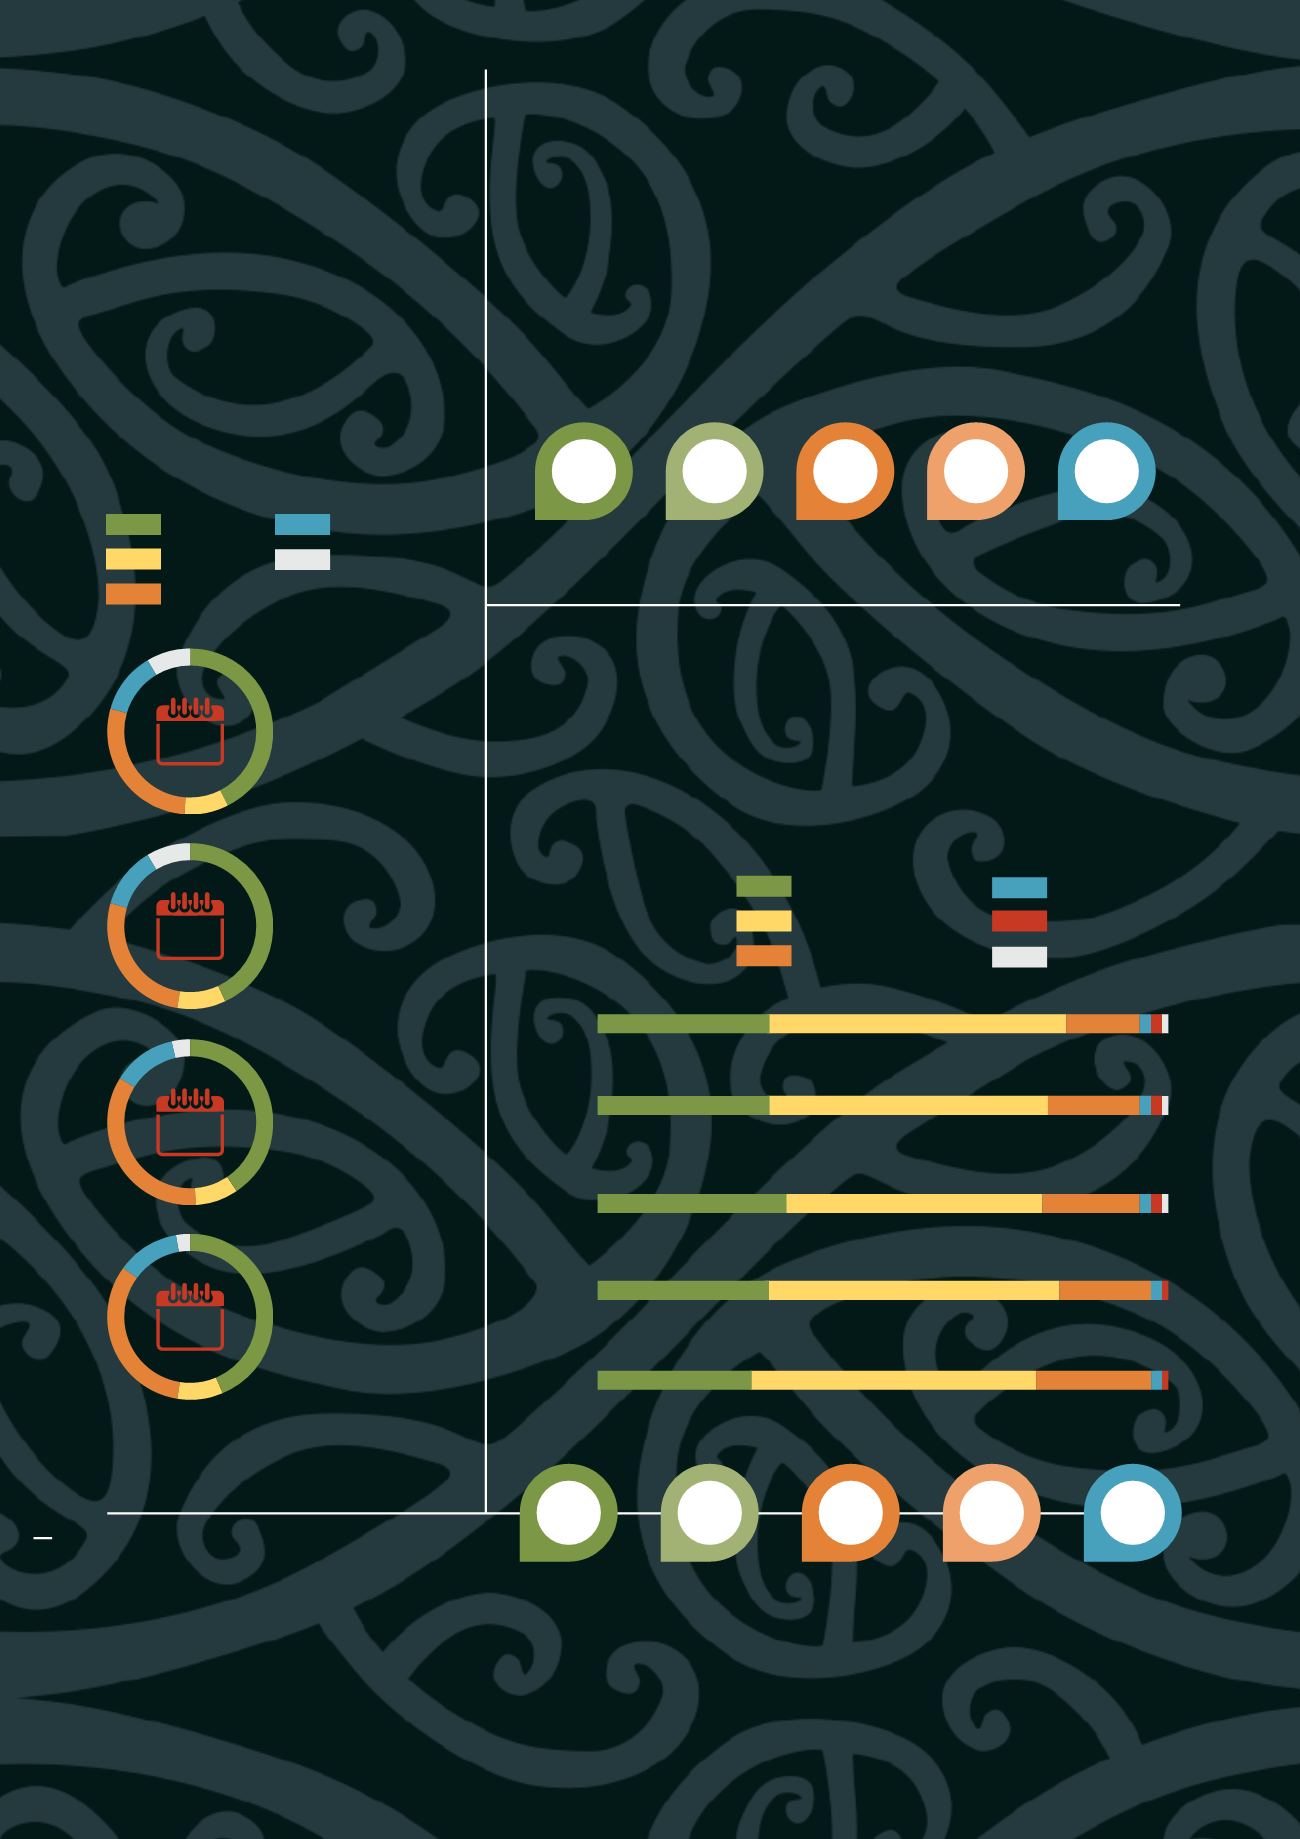
Prior activity
The prior activity of our tauira has remained relatively static over the past
five years with 49% (27% Non-workforce, 20% tertiary student and 2%
secondary student) of tauira indicating that they were not in the workforce
prior to joining us. The following chart shows five year trends for activities
tauira were engaged in immediately prior to enrolling with us.
Disabilities
One of our key drivers is to ensure that people who experience disadvantages within the tertiary education system have
equitable access to tertiary education. To reduce barriers, we ensure that we have facilities, resources and support systems
that tauira can draw from. In 2013, the proportion of tauira with disabilities remained similar to previous years at 16%. This
chart shows five year trends for the proportion of tauira enrolling with us who reported having a disability that required
additional support or resources.
12%
2010
15%
2011
17%
2012
16%
2013
11%
2009
Workforce
Tertiary student
secondary
overseas
NON-workforce
other
2009
30%
52%
13%
2%
2%
1%
2011
2012
2013
NB: These figures do not add up to 100%
as a person can select more than one
ethnicity.
2013
2012
2011
2010
30%
49%
16%
2%
2%
1%
2010
33%
45%
17%
2%
2%
1%
30%
51%
16%
2%
1%
27%
50%
20%
2%
1%


