 
          24
        
        
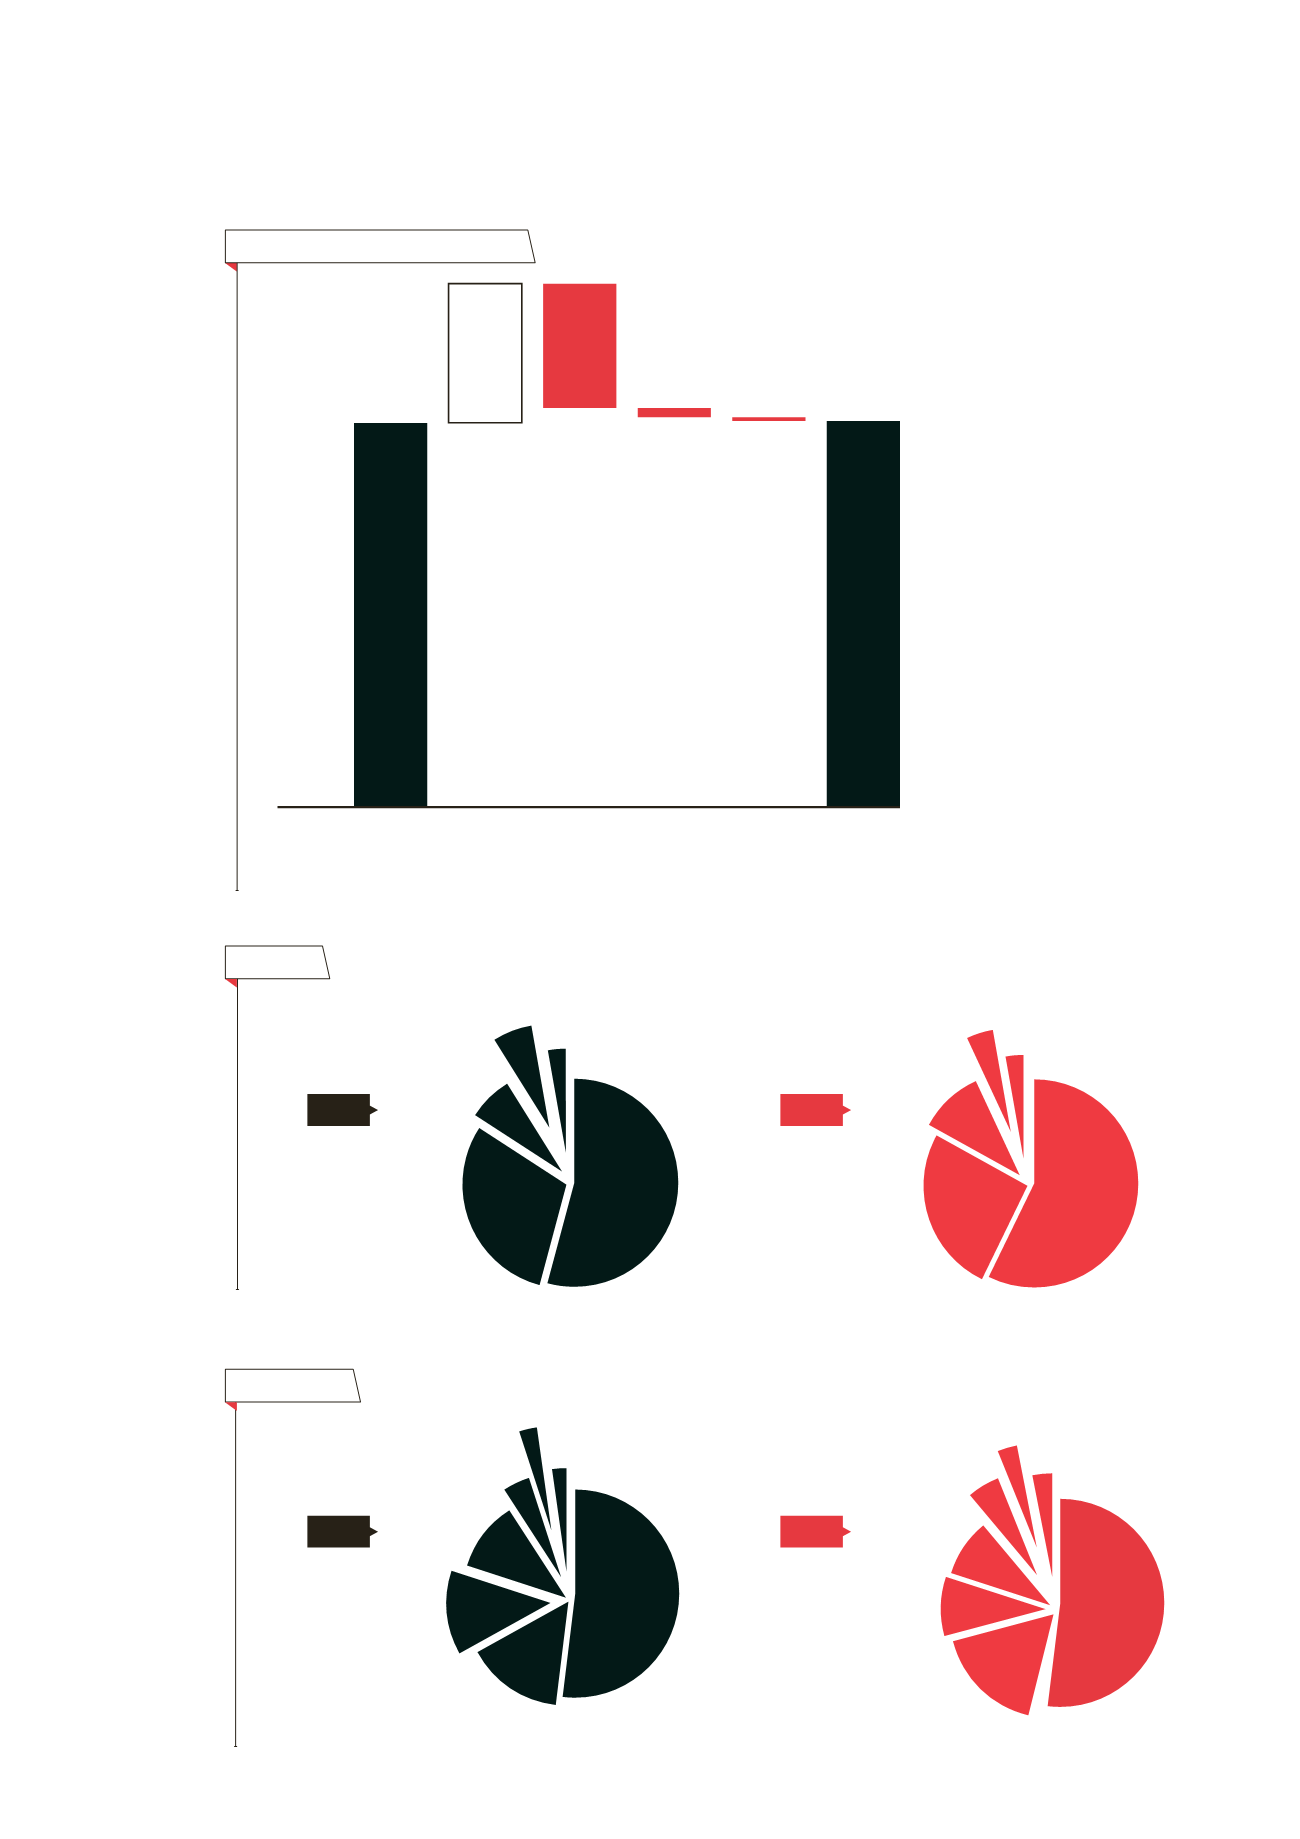
          Net operating profit movement
        
        
          Net
        
        
          operating
        
        
          profit
        
        
          2012
        
        
          Income
        
        
          Expenses Net
        
        
          finance
        
        
          Share of
        
        
          associates
        
        
          profit
        
        
          Net
        
        
          operating
        
        
          profit
        
        
          2013


            $M


            20.7


            (6.7)


            (0.5)


            (0.2)


            20.8


          Revenue
        
        
          Expenditure


            3%


            Quota leasing


            54%


            Rental


            30%


            Hotel


            7%


            Other


            6%


            Sale of sections


            3%


            Quota leasing


            57%


            Rental


            26%


            Hotel


            10%


            Other


            4%


            Sale of sections


            2013


            2013


            2012


            2012


            Key:


            The white bar represents


            increases in income in 2013


            which is offset by the red bars,


            representing increases in costs.


            The net result of the white


            and red bars will provide the


            movement between 2012 and


            2013 net operating profit.


            7.5


          0


            15%


            Employee costs


            13%


            Other


            11%


            Rental


            4%


            Sale of sections


            3%


            Cost


            of sales


            2%


            Depreciation and


            amortisation


            52%


            Hotel


            54%


            Hotel


            17%


            Employee costs


            9%


            Other


            9%


            Rental


            5%


            Sale of sections


            3%


            Cost


            of sales


            3%


            Depreciation and


            amortisation


            Total


            $62.7m


            Total


            $28.8m


            Total


            $22.0m


            Total


            $55.3m


          financial


            Overview