18
Portfolio
management
Cash Flows
Managing cash flows is crucial to
TGH. They are reported on and
managed weekly. The ability to do this
successfully has a cascading effect on
the timing of debt draw downs, and
therefore interest rate exposure. As a
high proportion of income is derived
fromproperty rental, cash inflows
are regular with very little deviation.
Cash outflows may spike according
to the various development projects
requiring funding, but otherwise
operating outflows also remain at
consistent levels.
Sustainability and quality of cash
flows are essential components of
TGH’s business. Theymust withstand
market fluctuations, and service
not only operating costs but also the
dividend to our Shareholder and debt
requirements.
Through its tenancy profile, TGH
is provided with stable, long-term,
high quality tenants such as Genesis,
Waikato Institute of Technology,
University of Waikato, Kiwi Income
Property Trust and Crown agencies. In
2013, these tenants generated the bulk
of investment property cash inflow,
comprising 23% of total rental revenue,
down from 29% in 2012.
TGH’s rental cash flows are now
predominantly from retail tenants at
. TGH’s increased exposure
to the retail sector prompts a hands-
on approach to tenant relationship
managemesant and debt collection.
A careful and considered approach
is applied to property development.
Before any property development is
approved, its feasibility is analysed
to ensure that the project’s cash flows
meet internally developed risk-
adjusted hurdle rates.
The most significant development
undertaken in TGH’s history was
the construction of
at
. The development was broken
into multiple stages, so TGH received
rental revenue as each stage was
completed, allowing debt to be serviced
accordingly. Before commencing each
stage, a committed leasing threshold
also had to be met to provide surety of
cash inflows. The approach taken there
will also be applied to future property
developments. Another significant
development was the construction of
the
Built
during the global financial crisis,
with demand for construction at a low
point, the pricing was competitive.
Economic Value Added and
Sector Reporting
TGH’s market is as wide and varied as
the business TGH operates. However,
the nature of the core business placed
TGH in the investment property sector
in 2013 (This is set to change from
2014 as outlined in the Chairman
and CEO’s reports). Largely based in
Waikato, TGH owns a significant
footprint in the Hamilton area where
competitors are commercial landlords,
retail operators and residential and
commercial property developers.
TGH periodically compares its
performance to market benchmarks
to assess returns on investments.
The balance sheet consists mostly of
tangible assets that are reported at
market value, and so an Economic
Value Added (EVA) analysis is suited
to TGH’s business. Unlikemost
property companies however, TGH
is compelled to hold significant
parcels of strategic undeveloped land
that have considerable value. There
are also parcels of land that are of
significance toWaikato-Tainui which
cannot be sold and whose returns
would otherwise be considered low
by comparison to sector benchmarks.
This has the inevitable impact of
eroding traditional performance
metrics such as return on assets (ROA)
and return on equity (ROE).
TGH has evolved its EVA reporting to
187
2013
Key
Covenant:
Covenants are the financial measures
which TGH must abide by under the terms of the
bank debt facilities and only apply to the entities
within the Group that have provided guarantees.
Interest cover ratio covenant:
Interest cover
ratio calculates the number of times the profit
(before interest cost) exceeds interest costs.
The ratio must be more than two times.
Gearing percentage covenant:
The gearing
percentage covenant is the equity as a
percentage of the total tangible assets.
2.0
67%
60%
Minimum Covenant
March 2013 Covenant
Quasi equity as a % of total tangible assets
Operational
review
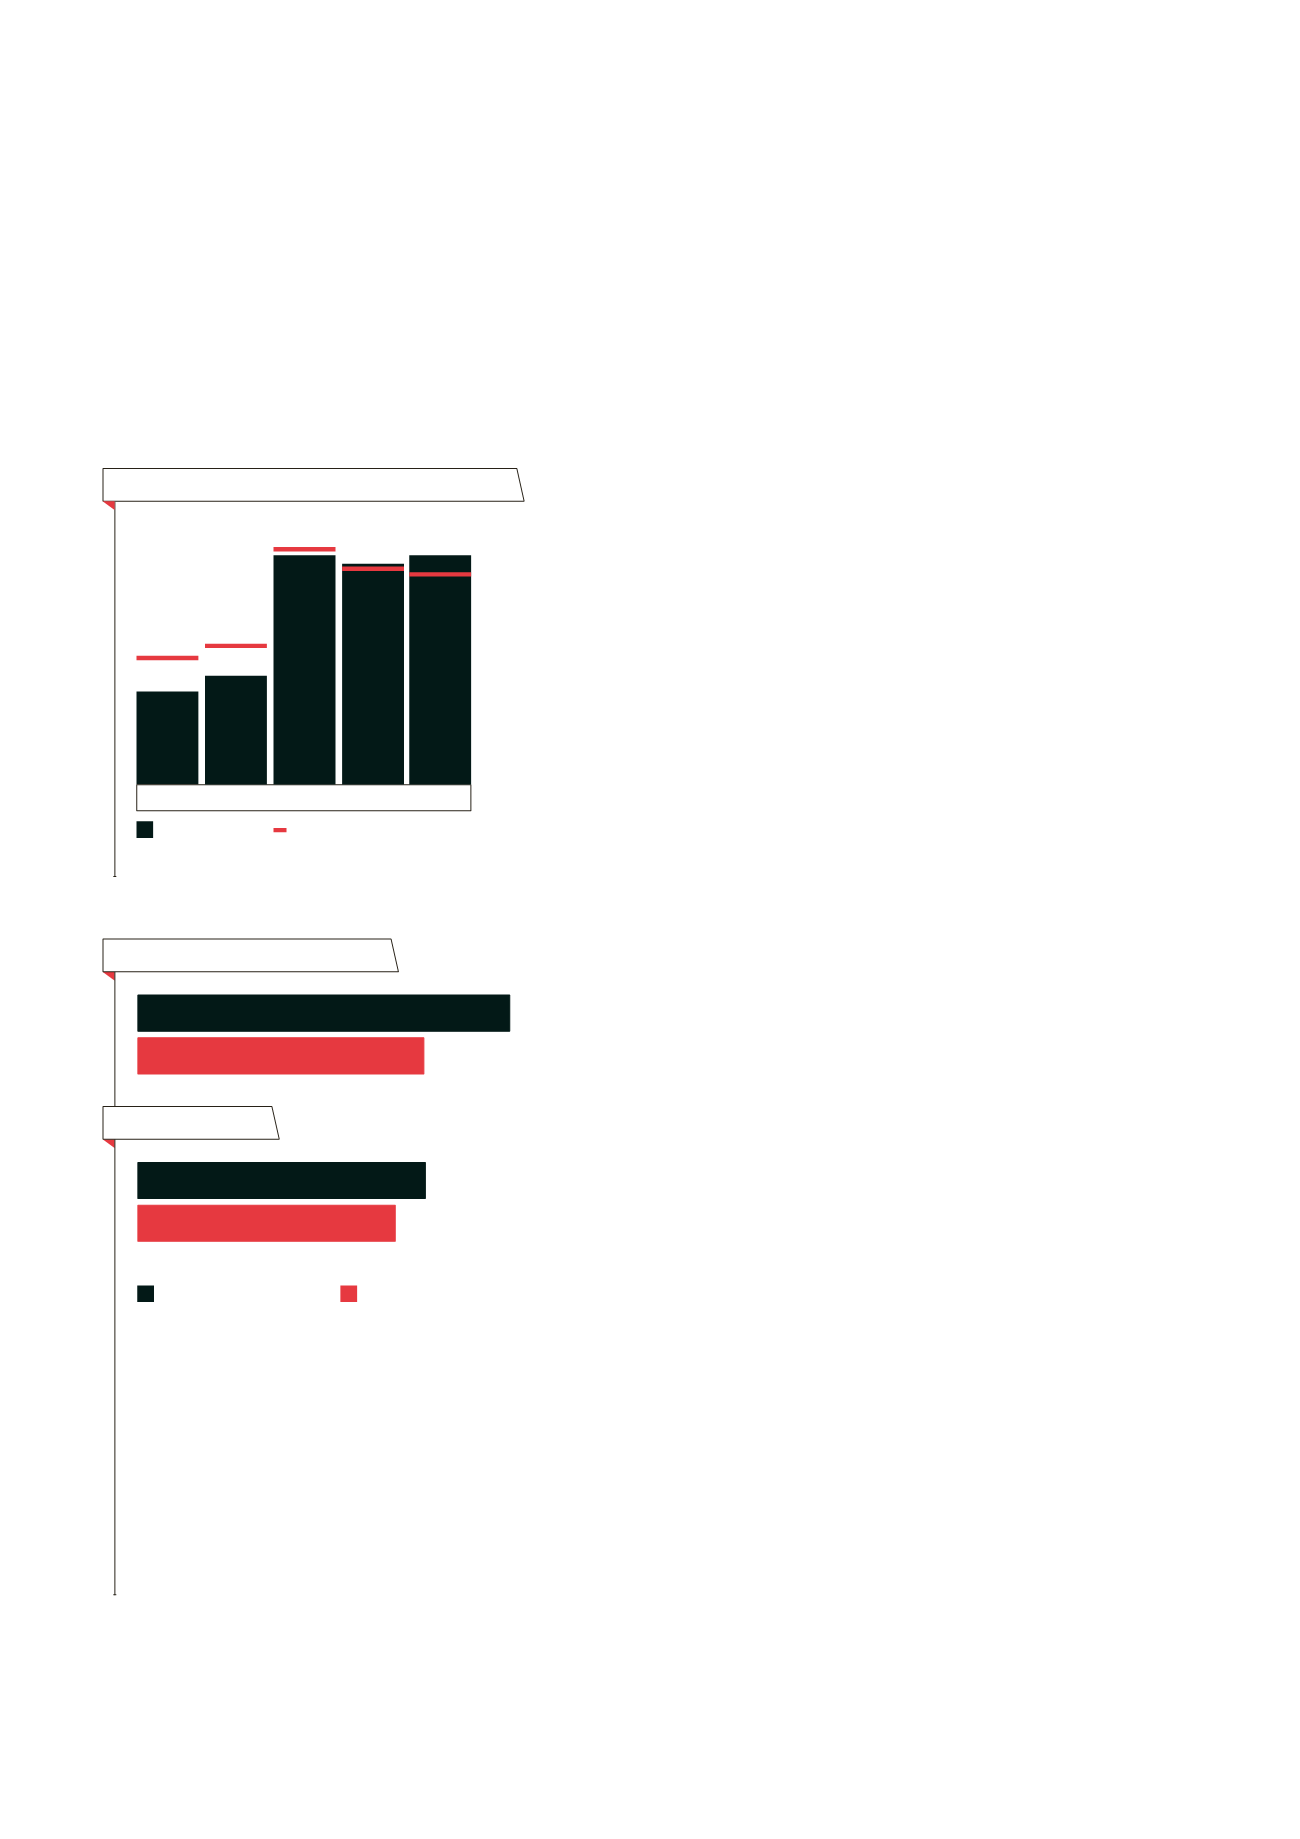
Interest cover position (ratio)
Gearing position
Interest bearing liabilities (bank debt) - tgh
75
2009
88
2010
187
2011
180
2012
Bank debt
Debt to total assets gearing
15.5% 17.0%
28.9%
26.5% 25.8%
Maximum gearing = 30% debt: total assets
2.6
2013
187


