20
Investment Properties
TGH’s investment properties comprise
79% (2012
:
78%) of the company’s total
assets. In 2013, they out-performed the
listed property sector average in terms of
growth in both value and cash, despite a
relatively flatmarket over the past year.
Ahigh proportion of Crown tenants
with good quality covenants, long term
leases provide a significant contribution
to both rental revenue and capital
growth. Ground leases provide further
stability as tenants have a shared
interest in retaining their tenancies
and renewing beyond the initial lease
expiry date. Our property values
have been boosted by the statutory
planning progress at Ruakura. The
retail sector also contributed to growth
due to tenant mix improvements,
retail sales increases, infrastructural
improvements made to support the
existing retail and planned expansion.
The values of all other property sectors
have remained relatively static.
Acquisitions and Disposals
TGH continually reviews its property
portfolio to ensure that all its
investments are providing appropriate
returns. While a number of acquisition
opportunities were presented in
2013, there were only two properties
that were purchased. Both were at
Rotokauri, and were acquired for
added residential development. Three
properties were disposed of during
the year. Two properties in Hamilton,
located in Hill Street and Queens
Avenue, were considered uneconomic
to retain or develop. The third
property sold was part of the former
Hort Research block at Pukekohe,
which also proved difficult to develop
and low yielding. In total, 7.43 hectares
were purchased and 5.94 hectares sold
during 2013.
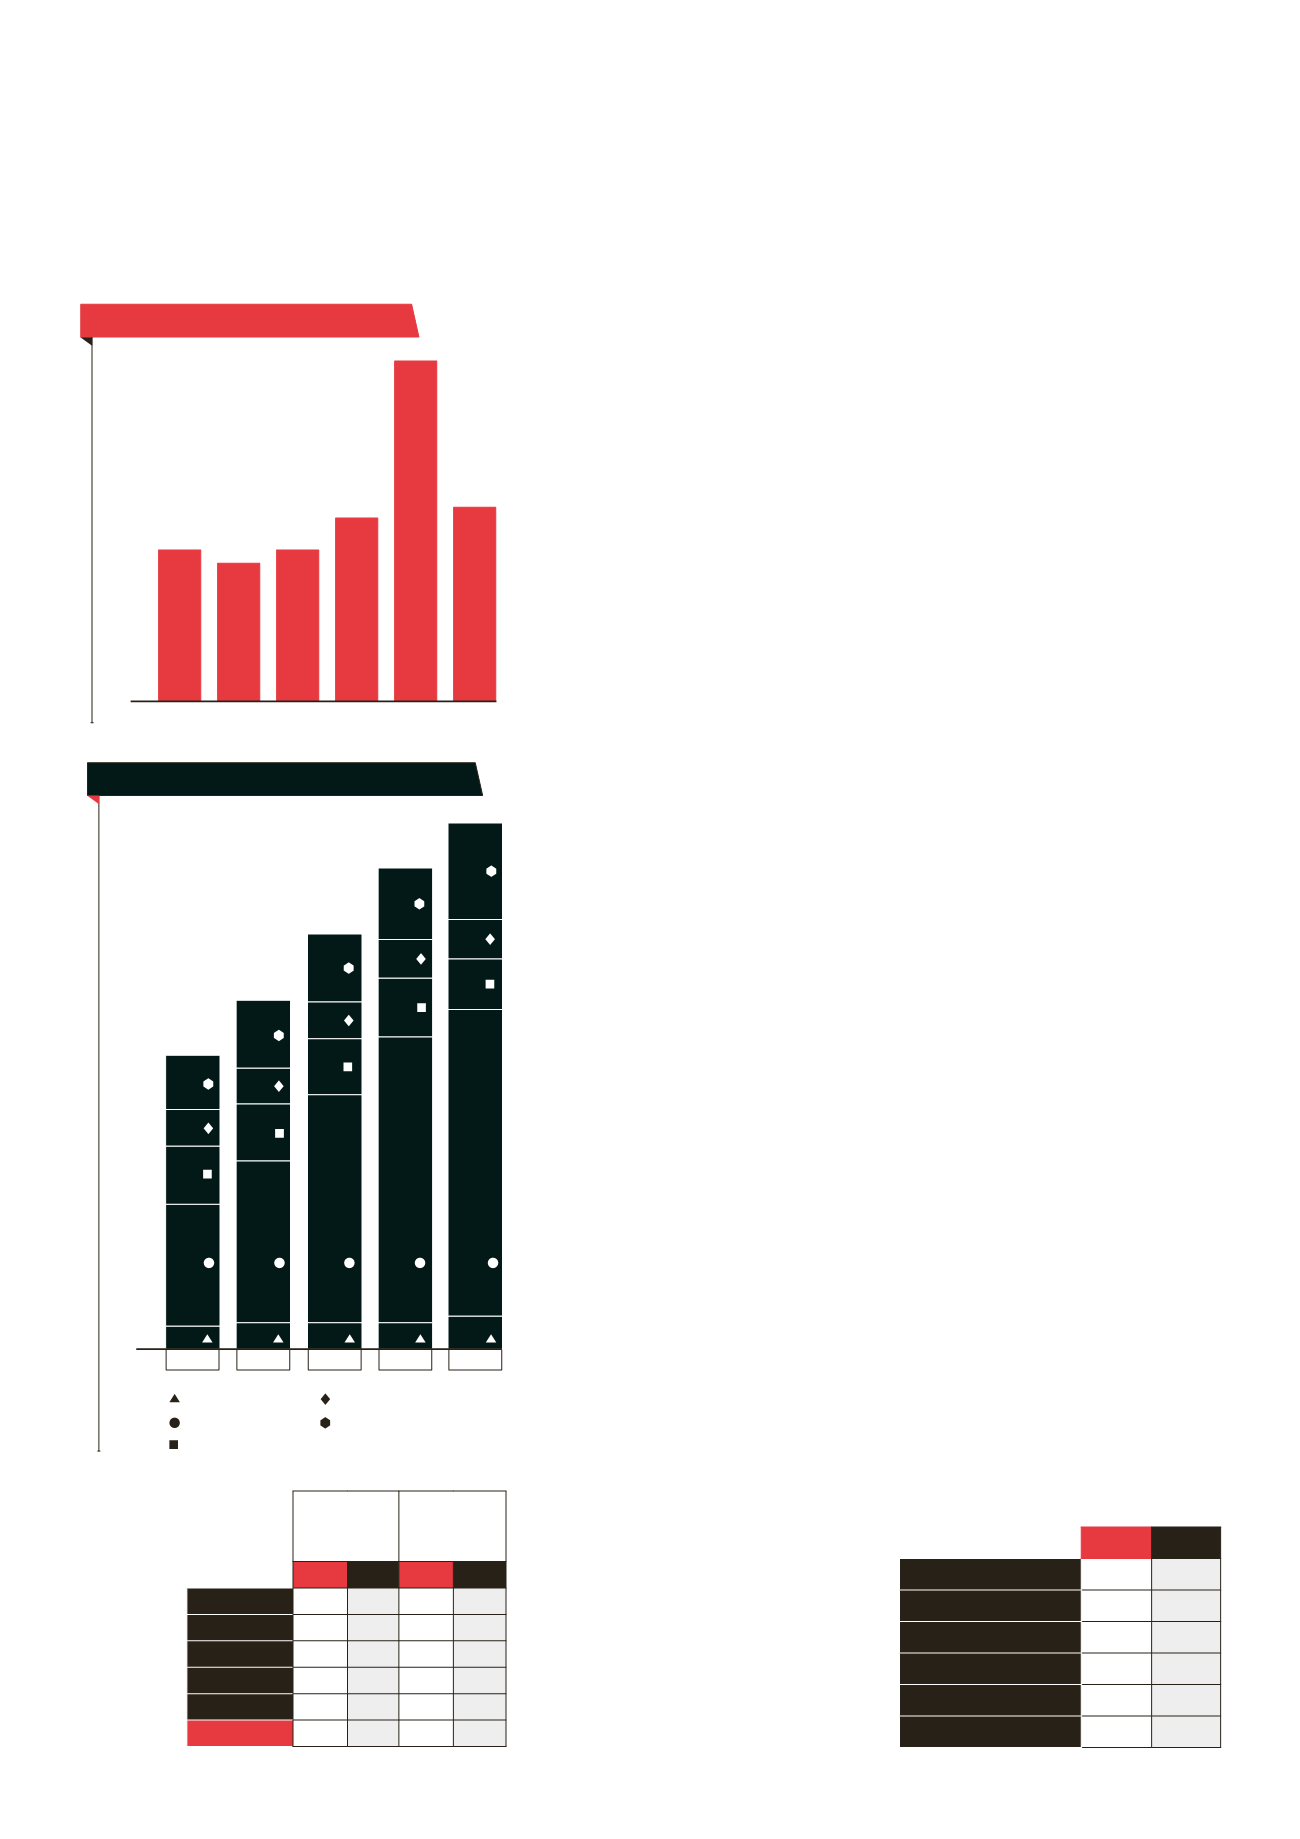
Weighted average lease term - tgh
Years
0
5.7 5.2 5.7
6.9
12.8
7.3
Rural
Office Retail Industrial Public Portfolio
2009 2010 2011 2012 2013
Investment property porfolio value - tgh
$M
0
133 176 248 311 334
63
62
61
64
55
25 29 29 29 36
40
39
40
42
43
59
74
74
78
105
Office/comercial
Retail
Public sector
Industrial
Rural/industry
Investment and
Management
135 rent reviews were completed during
the financial year which resulted in
additional revenue of $1.2 million,
providing an uplift of 4.4% over prior
rentals. Total occupancy for 2013 was
99% (2012
:
98%) at year end. Occupancy
was maintained at high levels
throughout the year as industrial and
retail vacancies were filled.
Profile
is New Zealand’s first super
regional shopping centre due to its
scale, the diversity of its retail offering
and high number of anchor tenants.
Consequently it draws a significant
proportion of its patronage from
regional areas, in addition to Hamilton
City, enhanced by excellent customer
access with the network of major
arterial roads connecting to
continues to be the country’s
largest retail development comprising
large format retail (LFR), food and
hospitality, a large DIY offer, an outlet
centre and an enclosed specialty
retail shopping mall which includes a
cinema complex.
During the year a further 18
tenants signed lease agreements and
commenced trading at
including 12 new tenants in
,
3 new LFR tenants and 2 tenants that
were relocated. In total
has
190 tenants, 109 in
and 31
outlet tenants (such as DressSmart) and
50 LFR tenants.
Akey strength of
continues to
be customer car parking, roading layout
and car-parkingmanagement system.
Investment
property
portfolio
summary
Property
asset value
($million)
Occupancy
(%)
2013 2012 2013 2012
Retail
334 311 99 100
Rural
105 78 100 100
Public
55 64 98 95
Industrial
43 42 100 100
Office
36 34 96 94
Total
573 528 99 98
2013 2012
Net lettable area (sqm)
82,622 81,171
Number of tenancies
190
180
Occupancy
99% 99%
Carparks
3,479 2,860
Pedestrian count
7.5m 7.1m
Vehicle count
3.9m 3.6m
Key statistics
The Base


